Dive into the world of consumer decision-making with our comprehensive guide to the budget equation. Learn how to analyze financial constraints and predict market behavior step-by-step.
![]()
Get the most by viewing this topic in your current grade. Pick your course now.
Now Playing: Budget equation – Example 0aUnderstanding the Changes to the Budget Constraint
Suppose a consumer can buy two goods, fruits and candy. The price of fruits is $5 each, and the price of candies are $10 each. If the consumer as an income of $50, then find the budget equation and graph it.
Suppose you are interested in two goods, monitors and laptops. The price of monitors is $200 each, and the price of laptops are $600 each. If your total income is $1200, then find the slope and y-intercept of your budget equation.
Suppose a consumer can buy two goods, fruits and candy. The price of fruits is $5 each, the price of candies is $20 each, and the consumer's income is $60. Suppose the income of the consumer increases to $100.
Suppose a consumer can buy two goods, pencils and erasers. The price of pencils is $2 each, the price of erasers is $1 each, and the consumer's income is $6. Suppose the price of erasers increase to $2.
StudyPug is a learning help platform covering math and science from grade 4 all the way to second year university. Our video tutorials, unlimited practice problems, and step-by-step explanations provide you or your child with all the help you need to master concepts. On top of that, it's fun — with achievements, customizable avatars, and awards to keep you motivated.

We track the progress you've made on a topic so you know what you've done. From the course view you can easily see what topics have what and the progress you've made on them. Fill the rings to completely master that section or mouse over the icon to see more details.


Make the most of your time as you use StudyPug to help you achieve your goals. Earn fun little badges the more you watch, practice, and use our service.

Play with our fun little avatar builder to create and customize your own avatar on StudyPug. Choose your face, eye colour, hair colour and style, and background. Unlock more options the more you use StudyPug.
Budget line & utilityRecall the budget line from last section. We will look further into what the equation of this line, and changes that could affect the budget equations.
The Budget Equation
If all income has been used for the goods, then the budget line is expressed by the linear equation:
x P x + y P y = I xP_x+yP_y=I x P x + y P y = I
Where
x → quantity of good x
y → quantity of good y
P x P_x P x → price of good x
P y P_y P y → price of good y
I → income
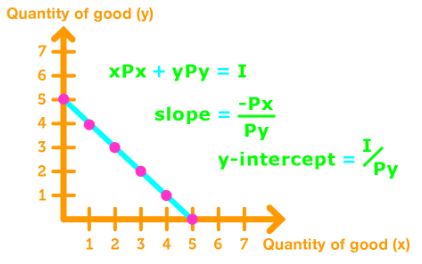
Note: The slope and y-intercept of the budget equation can be found by putting the equation into the form y = mx + b.
x P x + y P y = I xP_x+yP_y=I x P x + y P y = I → y P y = − x P x + 1 yP_y = -xP_x+1 y P y = − x P x + 1
→ y = − P x P y x + I P y y=- \fracx+\frac y = − P y P x x + P y I
Thus,
S l o p e = − P x P y , y − i n t e r c e p t = I P y Slope= - \frac,y-intercept=\frac Sl o p e = − P y P x , y − in t erce pt = P y I
Changes to the Budget Equation
The budget equation can be changed in 6 basic ways.
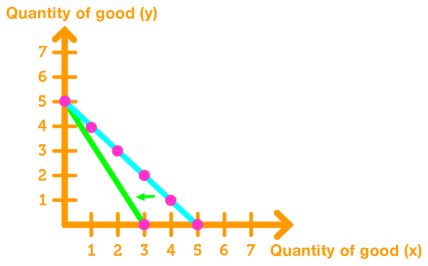
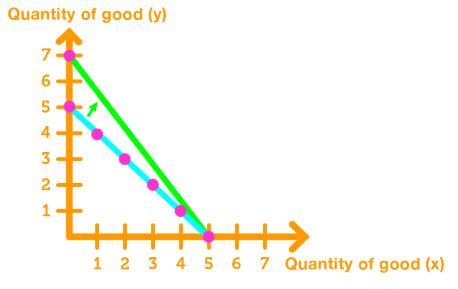
Increase the price of good x: The consumer will buy less of good x, causing the budget line to be steeper.
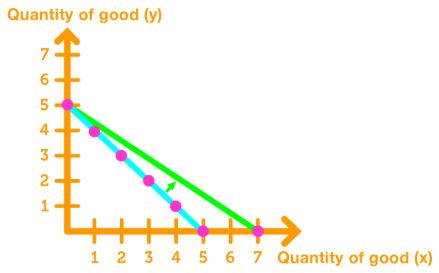
Decrease the price of good x: The consumer will buy more of good x, causing the budget line to be less steep.
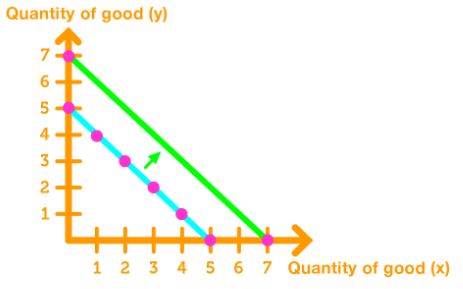
Increase the price of good y: The consumer will buy less of good y, causing the budget line to be less steep.
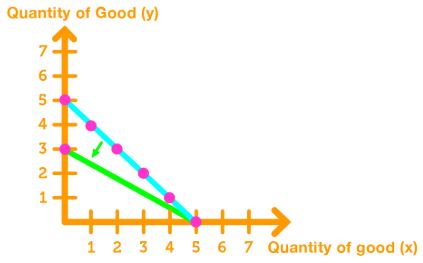 of good y" width="400" />
Decrease the price of good y: The consumer will buy more of good y, causing the budget line to be steeper.
 of good y" width="400" />
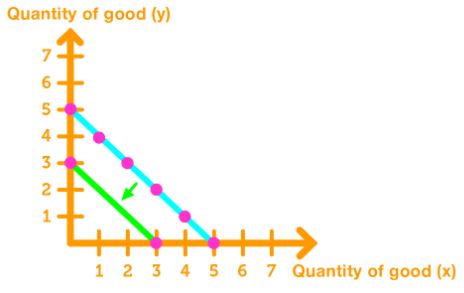
Increase the Income: The consumer will buy more of both goods, causing the budget line to shift rightward. The slope stays the same.
Decrease the Income: The consumer will buy less of both goods, causing the budget line to shift leftward. The slope stays the same.
Welcome to our exploration of the budget equation, a fundamental concept in microeconomics! This crucial tool helps us understand how consumers make choices within their financial constraints. The budget line, which is a visual representation of the budget equation, shows all possible combinations of goods a consumer can afford given their income and the prices of goods. In our introduction video, we'll dive into how this equation shapes consumer behavior and market dynamics. You'll see why it's so important for analyzing consumer choices and predicting market outcomes. As your friendly math tutor, I'm excited to guide you through this concept. We'll break it down step-by-step, making it easy to grasp and apply. Understanding the budget equation will give you a solid foundation for more advanced microeconomic topics. So, let's get started on this fascinating journey into the world of consumer decision-making!
Here are some frequently asked questions about the budget equation:
The standard formula for the budget equation is PxX + PyY = I, where Px and Py are the prices of goods X and Y, X and Y are the quantities of those goods, and I is the total income or budget.
The slope of the budget line is calculated as -Px/Py. This represents the rate at which one good can be exchanged for another while maintaining the same total expenditure.
When income increases, the budget line shifts outward parallel to the original line. This means the consumer can afford more of both goods, but the relative prices (slope) remain unchanged.
If the price of one good changes, the budget line pivots. For example, if the price of good X decreases, the budget line will pivot outward along the X-axis, allowing the consumer to purchase more of good X.
A budget line represents all possible combinations of two goods a consumer can afford given their income and prices. An indifference curve shows combinations of goods that give the consumer equal satisfaction. The optimal consumption point is where the budget line is tangent to the highest attainable indifference curve.
PrerequisitesUnderstanding the budget equation is crucial in economics, but to fully grasp this concept, it's essential to have a solid foundation in certain prerequisite topics. Two key areas that significantly contribute to comprehending the budget equation are budget line and utility and graphing linear functions using a single point and slope.
The concept of budget line is fundamental to understanding the budget equation. It represents the various combinations of goods that a consumer can purchase given their income and the prices of goods. By mastering this concept, students can better interpret how changes in income or prices affect consumer choices within the constraints of the budget equation.
Additionally, the utility aspect of the budget line and utility topic helps in comprehending how consumers make decisions to maximize their satisfaction within their budget constraints. This directly relates to the budget equation as it explains the rationale behind consumer behavior and spending patterns.
Equally important is the ability to graph linear functions. The budget equation is often represented graphically, and understanding how to plot these functions is crucial for visual analysis. By knowing how to use a single point and slope to graph linear functions, students can easily visualize budget constraints and how they change under different economic conditions.
Graphing skills are particularly valuable when analyzing shifts in the budget line due to changes in income or prices. This visual representation helps in understanding concepts like income and substitution effects, which are integral to the broader understanding of consumer theory and the budget equation.
Moreover, the ability to interpret graphs is essential in economics. When studying the budget equation, students often encounter graphical representations of indifference curves intersecting with budget lines. A strong foundation in graphing linear functions enables students to accurately read and analyze these graphs, leading to a deeper understanding of consumer equilibrium and optimal choice theory.
By mastering these prerequisite topics, students build a strong foundation for understanding the budget equation. The budget line concept provides the economic context, while the skills in graphing linear functions offer the mathematical tools needed to analyze and interpret the budget equation in various scenarios.
In conclusion, a thorough understanding of budget lines, utility, and graphing linear functions is crucial for students approaching the study of the budget equation. These topics provide the necessary economic intuition and mathematical skills to fully grasp the complexities of consumer behavior and market dynamics represented by the budget equation.